Matt Yglesias at ThinkProgress.org made an interesting observation the other day:
"why [are we] supposed to believe that conservative ideas will produce prosperity when the portions of the country most governed by conservative ideas tend to be least-prosperous"?
http://yglesias.thinkprogress.org/2010/09/postal-policy-in-the-csa/
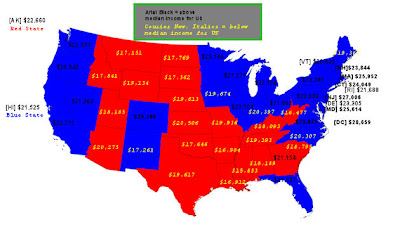
A friend contested that idea, so I decided to test his assertion for myself by identifying per capita income on a Red State/Blue State map.(Note first that I believe there is absolutely no correlation between income and a person's value, especially a state's per capita income and the value of any person in that state.)
And of course, there were more blue states than red states in 2008, so some of the blue states had to be below the median per capita state income.
Interestingly, there were only 2 red states above the median (Alaska - thanks oil resources) and Georgia. (Valuable peaches? Atlanta?)
Other than those 2, all of the red states were below the median per capita income.
As Matt asked, do we really want the economic ideas and practices of the lowest economic performing states to set our national economic principles and practices?
In this map, yellow type is for below the median, black is for above the median: I believe the correlations of red state/yellow type and of blue state/black type is instructive:

I'm a little leery of how you determined whether a state was red or blue - Florida is a blue state? If it was based on the 2008 Presidential election, that's a poor method.
ReplyDeleteApart from that, I think its obvious that states that invest more in education and infrastructure do better, that's why California and New York do so well.